|
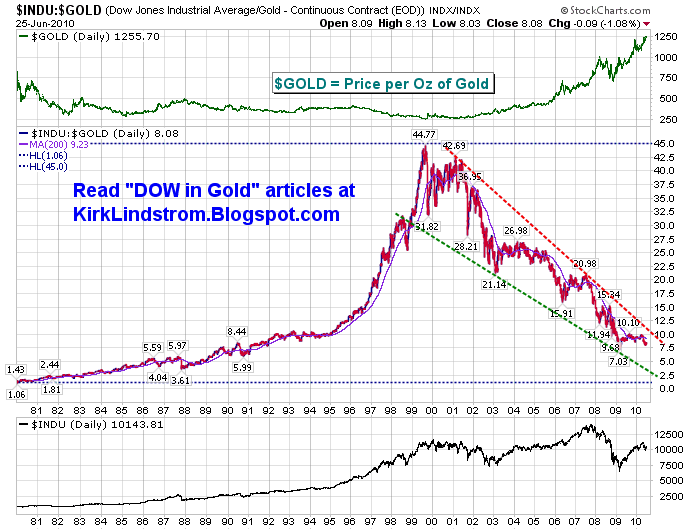
The DOW-Gold Ratio is the number of ounces of gold (Chemical symbol Au) required to buy one unit of the Dow Jones Industrial Average (DJIA)

|
Here is a DOW/Gold chart showing the current Dow to Gold Ratio, the ratio of the
price of the Dow Jones Industrial Average to the price of gold. When
measured in ounces of Gold, the DOW has been in a secular bear market
since peaking in late 1999.
Back in 1999, it took 45 ounces of gold to buy the DJIA.
On Friday March 6 of 2009 the DOW-Gold ratio hit a low of 7.03
As of Friday (May 9, 2009) it only took 9.36 ounces of gold to buy the DOW, a nice jump from the recent low. |
The markets, measured by the S&P500 (S&P500 Charts) and DIJA (DJIA Charts),
may have recovered to new highs in 2007, but the DOW:Gold ratio told a
different, truer story of just how unhealthy the US economy was.
|
|


