 |
US
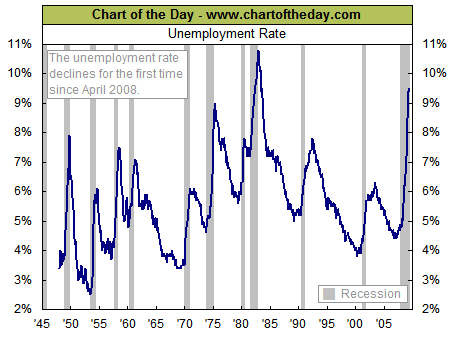
Unemployment Rate ==> " Historical Chart 1948 to 2009 " <== Chart Signals The Recession May Be Over! |
 |
|
|
||
==> Very Best CD Rates with FDIC <== |
Historical
CD Rates |
|
|
Today (August 7, 2009),
the
Labor Department reported (in their "jobs report") that the
unemployment rate actually decreased
from 9.5% to 9.4% during July. This
is the first decrease in the unemployment rate since April 2008.
For some perspective on the current state of the labor market, today's
chart illustrates the unemployment rate since 1948. Today's chart
illustrates that despite this month's encouraging decline, there was
only one general period in the post-World War II era during which the
unemployment rate was higher than the current rate of 9.4% (i.e. June
1982 - June 1983). It is worth noting, however, that a
one-month decline in the unemployment rate (even a small decline) after
a significant spike (i.e. the unemployment rate spikes by 1.5
percentage points or more) has tended to occur slightly after a
recession had ended.
 |
|