 Home: VeryBestCdRates -
Charts - 2009 - Inflation Adjusted Gasoline Prices
==> Highest APY CDs with FDIC
<== Home: VeryBestCdRates -
Charts - 2009 - Inflation Adjusted Gasoline Prices
==> Highest APY CDs with FDIC
<== |
||
 |
Gasoline
Prices ==> " Inflation Adjusted 1980 - 2009 " <== |
 |
|
|
||
==> Very Best CD Rates with FDIC <== |
Historical
CD Rates |
|
|
"One positive outcome of
the
financial crisis was that gasoline prices did plunge from their record
highs – down 60% peak to trough. Beginning at the end of 2008, however,
gasoline prices have surged and are currently 61% above their December
2008 lows.
Today’s chart provides some perspective on the recent spike with a long-term view of the average US price for a gallon of unleaded gasoline. It is interesting to note that most gasoline price spikes were a result of Middle East crises and often preceded or coincided with a US recession. So while gasoline prices are currently well below the record high levels of 2007, this recent rally has brought prices to a level well above what was witnessed from 1984-2004 – a two decade span of relative energy price stability." 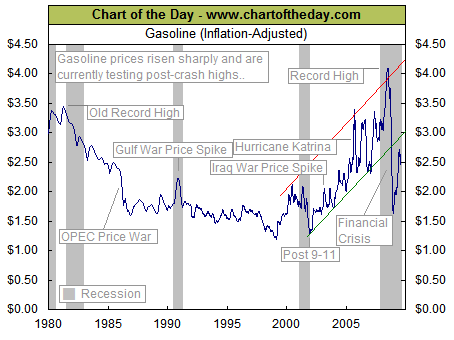 |
|