 |
US
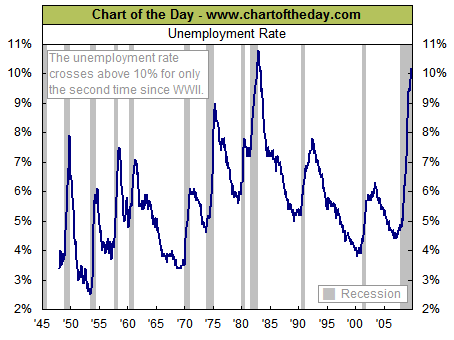
Unemployment Rate ==> " Historical Chart 1948 to October 2009" <== |
 |
|
|
||
==> Very Best CD Rates with FDIC <== |
Historical
CD Rates |
|
|
Chart of the U.S.
unemployment
rate which climbed to 10.2% in October, topping the 10% mark for the
first time in 26 years. The Labor Department reported this data
Friday November 6, 2009
Chartoftheday.com wrote: "Today, the
Labor Department reported that the (October 2009) unemployment rate
increased to 10.2% -- a 26-year high. For some perspective on the
current state of the labor market, today's chart illustrates the
unemployment rate since 1948. As today's chart illustrates, today's
move above the 10% threshold marks only the second time such a move has
occurred during the post-World War II era. It is also worth noting that
the unemployment rate has tended to peak shortly after the end of the
recession. Following the previous two recessions, however, the
unemployment rate kept rising for many months following the beginning
of an economic "expansion.""
Top CD Rate Survey CD
Rates at Largest US Banks
|
|
