 |
Stocks:
Average
Bull Market Gain and Duration |
 |
|
|
||
More Charts and Quotes at: DJIA Charts - S&P500 Charts - NASDAQ Charts |
||
|
On March 19, 2010
Chartoftheday.com wrote:
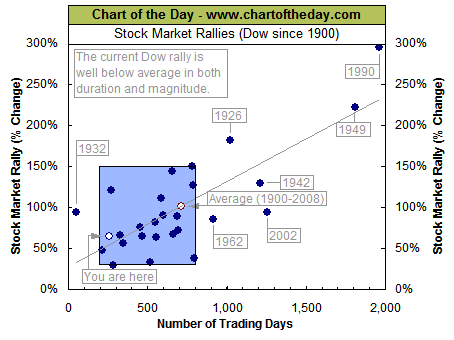
"The Dow continues to make
new rally highs. To provide some perspective to the current Dow rally
that began just over one year ago, all major market rallies of the last
110 years are plotted on today's chart. Each dot represents a major
stock market rally as measured by the Dow. As today's chart
illustrates, the Dow has begun a major rally 27 times over the past 110
years which equates to an average of one rally every four years. Also,
most major rallies (73%) resulted in a gain of between 30% and 150% and
lasted between 200 and 800 trading days -- highlighted in today's chart
with a light blue shaded box. As it stands right now, the current Dow
rally (hollow blue dot labeled you are here) has entered the low range
of a "typical" rally and would currently be classified as both short in
duration and below average in magnitude."
Top CD Rate Survey CD
Rates at Largest US Banks |
|
| Source: Chart of the Day
Journalists and bloggers may post the above free Chart of the Day on their website as long as the chart is unedited and full credit is given with a live link to Chart of the Day at http://www.chartoftheday.com. |
|
