 |
Inflation
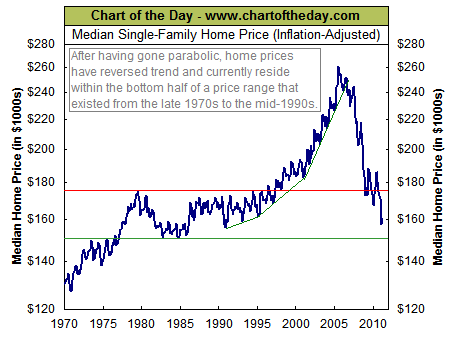
Adjusted Home Prices Median single-family home prices adjusted for Inflation |
 |
|
|
||
Best Mortgage Rates |
||
|
On
April 21, 2011 Chartoftheday.com wrote:
"For some perspective on
the all-important US real estate market, today's chart illustrates the
inflation-adjusted median price of a single-family home in the United
States over the past 41 years. Not only did housing prices increase at
a rapid rate from 1991 to 2005, the rate at which housing prices
increased -- increased. That brings us to today's chart which
illustrates how the inflation-adjusted median home price is currently
38% off its 2005 peak. That's a $100,000 drop. In fact, a home buyer
who bought the median priced single-family home at the 1979 peak has
actually seen that home lose value (8.5% loss). Not an impressive
performance considering that more than three decades have passed. It is
worth noting that the median priced home is currently in the bottom
half of a price range that existed from the late 1970s into the
mid-1990s"
Chart showing: Historical
Mortgage Rates |
|
| Source: Chart
of the Day Journalists and bloggers may post the above free Chart of the Day on their website as long as the chart is unedited and full credit is given with a live link to Chart of the Day at http://www.chartoftheday.com. |
|
| More Charts: |
