 Home: VeryBestCdRates - Charts
- 2011 - Inflation Adjusted Oil Prices ==> Highest Yield CDs with
FDIC <== Home: VeryBestCdRates - Charts
- 2011 - Inflation Adjusted Oil Prices ==> Highest Yield CDs with
FDIC <== |
||
 |
Inflation
Adjusted Oil Prices ==> " Historical Chart 1970 to 2011" <== |
 |
|
|
||
Historical
CD Rates |
Crude Oil - Crude Oil ETFs for current prices and Inflation Adjusted Gasoline Prices |
|
|
"The decline in crude
oil prices that began in mid-2008 was historic -- plunging over $90 per
barrel in just eight months. Over the past two years, however, crude
oil prices have increased by over $60 per barrel. Today's chart
provides some perspective on the historic decline and recent spike with
a long-term view of inflation-adjusted West Texas Intermediate Crude.
Today's chart illustrates that most oil price spikes were a result
of Middle East crises and often preceded or
coincided with a US recession. It is also interesting to
note that the recent spike in oil prices has brought the price of oil
back to a historically high level -- a level that was surpassed only
briefly during the tail-end of the major price spikes of 1980 and 2008."
See Crude Oil - Crude Oil ETFs for current prices 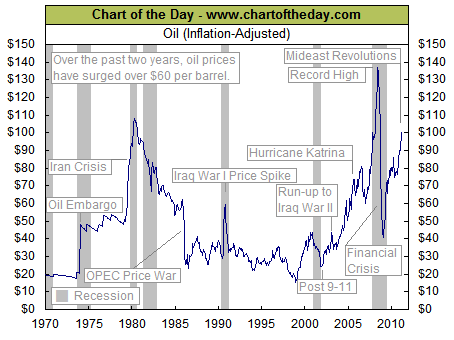 |
|
| Source: Chart of the Day
(using data from the National Bureau of Economic Research) Journalists and bloggers may post the above free Chart of the Day on their website as long as the chart is unedited and full credit is given with a live link to Chart of the Day at http://www.chartoftheday.com. |
|
TOP OF PAGE |
Article: How to Get the Best CD Rates