 |
Inflation
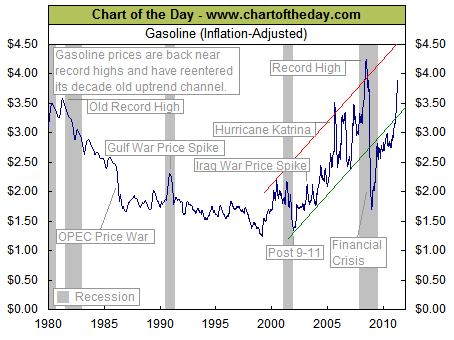
Adjusted Gasoline Prices ==> " Historical Chart 1980 to April 2011" <== |
 |
|
|
||
Historical
CD Rates |
Crude Oil - Crude Oil ETFs for current prices and Inflation Adjusted Oil Prices |
|
|
As a result of ongoing
geopolitical tensions as well and increasing global demand, the price
of crude oil continues to trend higher. Over the past eight months, the
cost of one barrel of crude oil has increased by over $40. With oil
prices trending higher, it is not all that surprising to find that
gasoline prices are following suit. Since the financial crisis lows at
the end of 2008, the average US price for a gallon of unleaded has
risen $2.18 per gallon. The only time when gasoline prices were higher
than today was during a brief three-month period in mid-2007, just
prior to the Great Recession.
 |
|
| Source: Chart of the Day
(using data from the National Bureau of Economic Research) Journalists and bloggers may post the above free Chart of the Day on their website as long as the chart is unedited and full credit is given with a live link to Chart of the Day at http://www.chartoftheday.com. |
|