 |
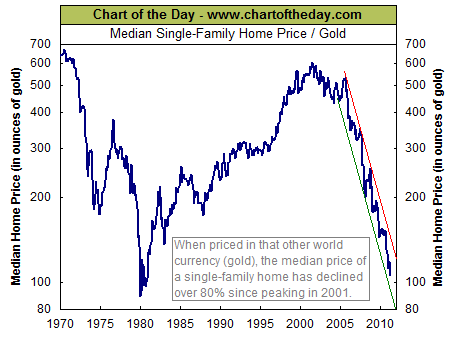
Median
Single-Family
Home Priced in Gold Median single-family home price divided by the price of an ounce of gold |
 |
|
|
||
More Charts and Quotes at: DJIA Charts - S&P500 Charts - NASDAQ Charts |
||
|
Same chart from March
2011. Also see Inflation
Adjusted Home Prices.
On June 10, 2011 Chartoftheday.com1 wrote: "Declining real estate
prices continue to be a concern for investors. For some perspective on
the magnitude of the decline in home prices, today's chart presents the
median single-family home price divided by the price of one ounce of
gold. This results in the home / gold ratio or the cost of the median
single-family home in ounces of gold. For example, it currently takes a
relatively low 106 ounces of gold to buy the median single-family home.
This is dramatically less than the 601 ounces it took back in 2001.
When priced in gold, the median single-family home is down over 80%
from its 2001 peak (to a level last seen in 1980) and remains well
within the confines of a six-year accelerated downtrend and continues
to close in on its 1980 trough."
US
Treasury Rates at a Glance |
|
||||
Note 1. Source:
Chart of the Day
"Journalists
and bloggers may post the above free Chart of the Day on their website
as long as the chart is unedited and full credit is given with a live
link to Chart of the Day at http://www.chartoftheday.com."
|
|||||
| More Charts: |
TOP OF PAGE |
Article: How to Get the Best CD Rates


